***** Panelist Performance - Reps Standard Deviation Summary *****
Purpose
-------
The Panelist Performance Reps Standard Deviation Summary report allows for a detailed review
of consistancy over reps for each panelist performance by calculating the standard deviation of
responses to attributes for each rep of each sample by each of the panelists.
Two Rep Tests are required for this report.
Attributes
----------
Attributes types included on the report are Line Scales, Hedonics, and Grouped Intensity.
Reports Excel Tab #1
--------------------
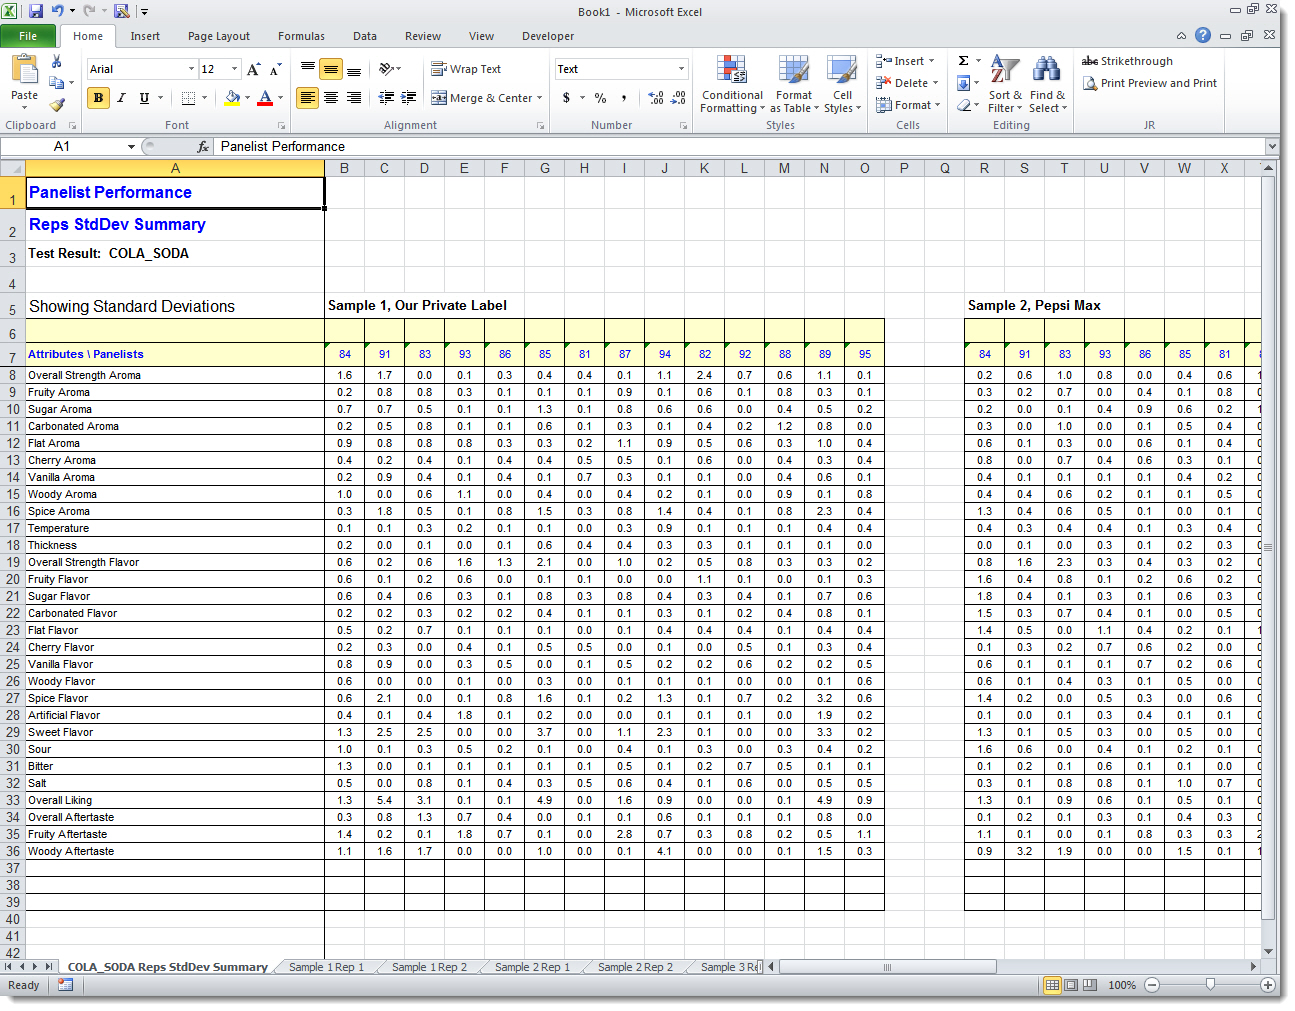
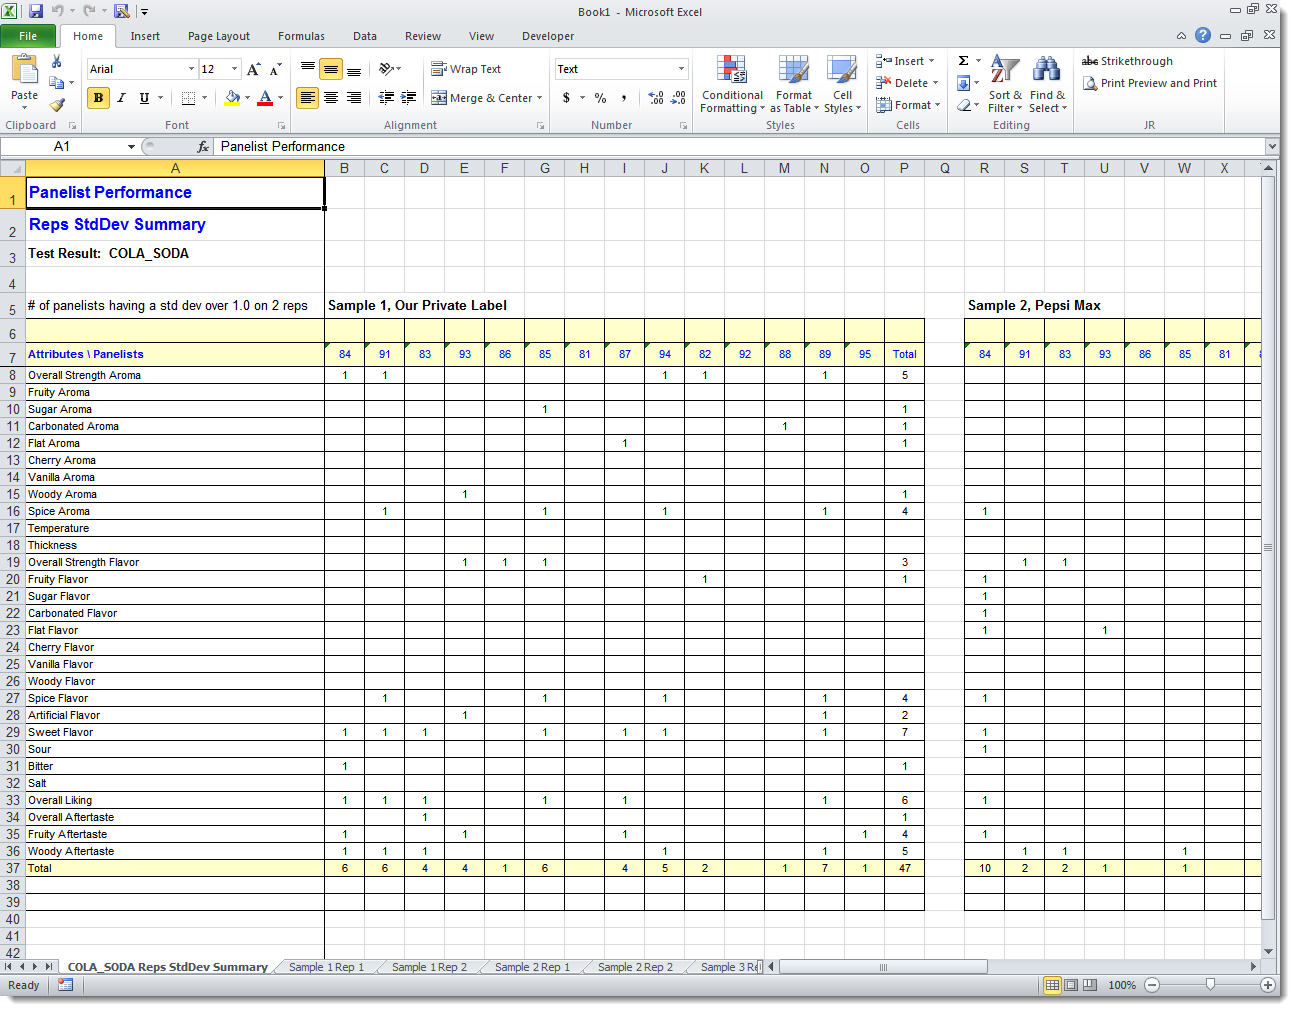
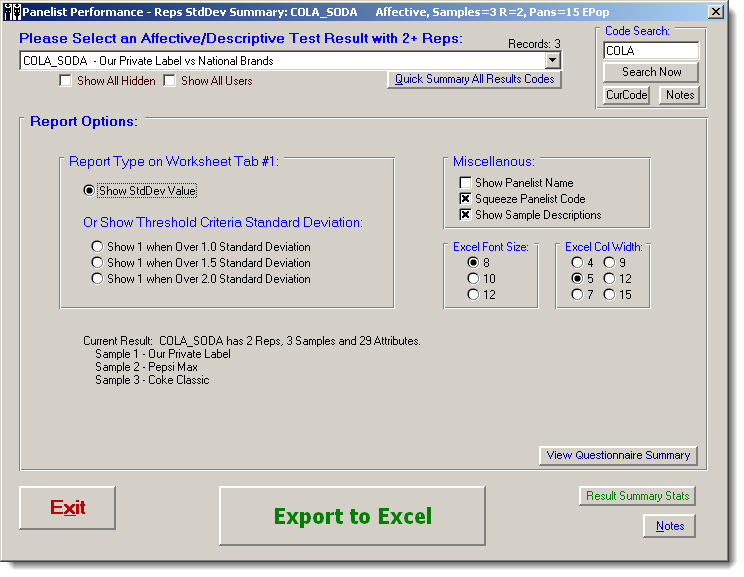
You may choose to Show StdDev Values or Show Threshold Criteria Standard Deviation.
Standard Deviation are calulated using Excel Function STDEV()
Interpretation:
Lower standard deviation values are preferable which indicate lower variation of data responses.
Example Excel formula when 2 reps: =STDEV('Sample 1 Rep 1:Sample 1 Rep 2'!B8)
Threshold Criteria Standard Deviation are calulated based on above Excel Function STDEV()
Interpretation:
The 1's indicate over the acceptable criteria threshold for standard deviation values.
Less 1's are better.
Example Excel formula when 2 reps: =IF(STDEV('Sample 1 Rep 1:Sample 1 Rep 2'!B8) > 1.5, 1, "")
Raw Test Data
-------------
Panelist's Raw Test Data scores for each sample and rep is listed on separate worksheet tabs.
Attribute descriptions are listed by rows.
Panelist names and codes are listed by columns.
Excel Worksheet Tabs
--------------------
The report will create Excel Worksheet Tabs for every Sample & within every Rep.
The 1st Tab will always be the Summary StdDev Report, the remainder will be the detail underlying data.
The #Tabs = 1 + (number of samples X number of reps)
|

 HOME
HOME

 VIEW REPORTS