
 HOME
HOME CONTACT
 SUPPORT
 SENSORYTEST.COM
 |
 HOME HOME CONTACT CONTACT SUPPORT SUPPORT SENSORYTEST.COM SENSORYTEST.COM |
|
Sensory testing professional's favorite virtual desktop. Say hello to SIMS Cloud Systems. From any device, any laptop, any iPad and even your cell phone. Log in from anywhere anytime. Inquire today. 
|
Mobile devices real test example Point your cell phone camera Easy for your respondents 
Link |
 VIEW REPORTS
 |
 QUESTION CHOICES
 |
 TEST CHOICES
 |
View More Question Type Choices |
| CONTINUOUS TIME INTENSITY
This webpage shows Continuous Time Intensity in Questionnaires. Also see Time Delay Also see Time Interval Intensity Also see Time Intensity Continuous Also see Time TDS Temporal Dominance of Sensations Also see Time Counter Seconds Continuous Time Intensity - Questionnaire & Report Examples Online 
In-House 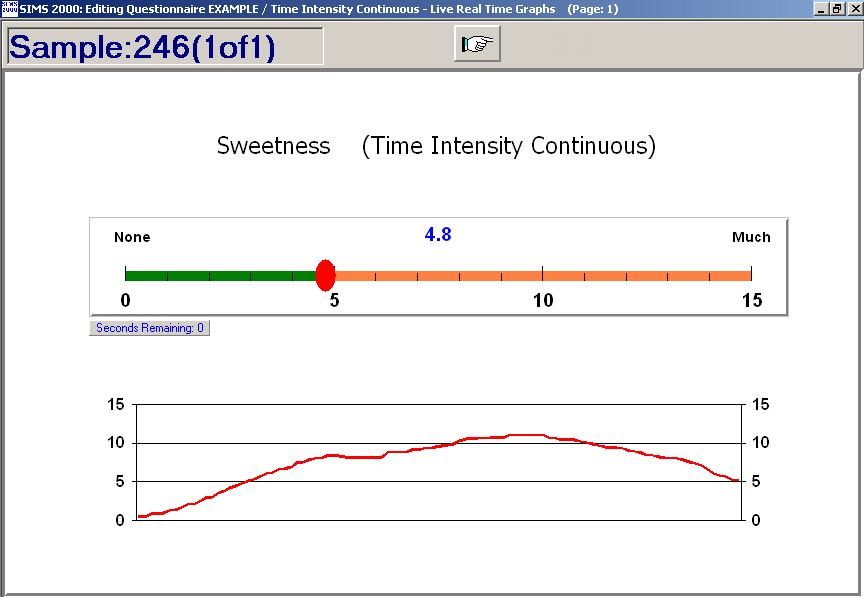
Note that the above example shows the *optional* live real time graph. In-house only. Here's a ballot setup options screen 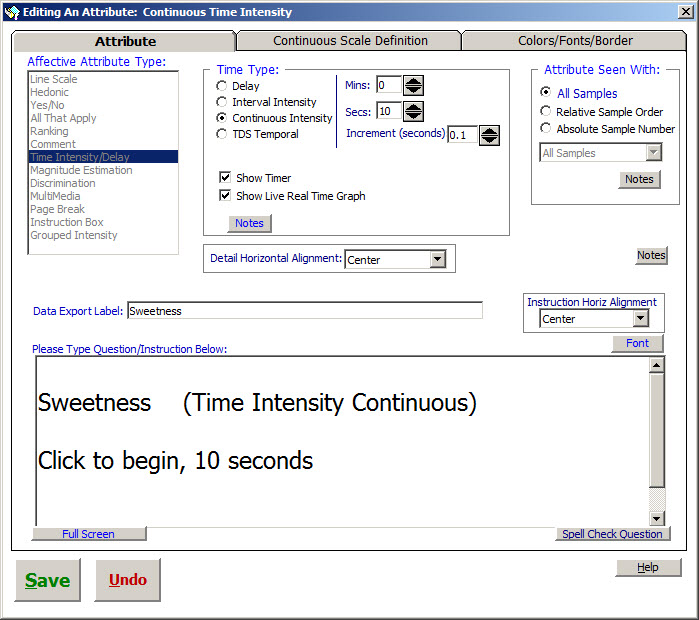
SIMS software express package file: TIME-TIC.SIMS2000ExpressPackage.sql.ZIP |
View More Report Types |
|
CONTINUOUS TIME INTENSITY - REPORTS
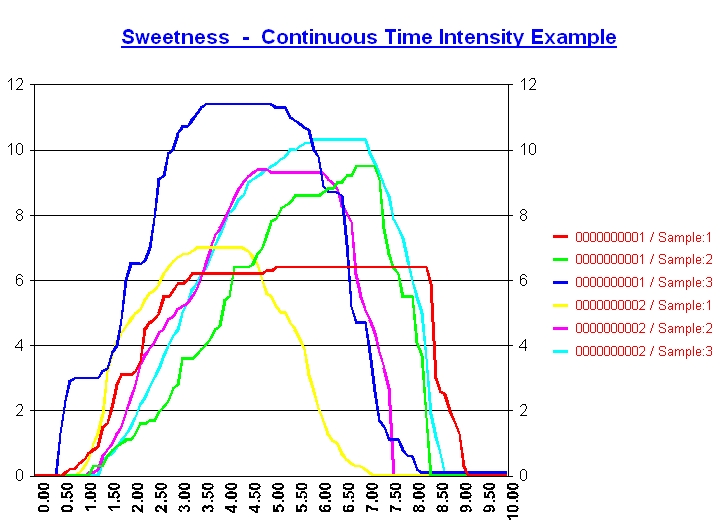
SIMS has been enhanced with continuous time-intensity following the guidelines outlined in the ASTM E-18 document: ASTM E1909 - 97(2003) Standard Guide for The Time-Intensity Evaluation of Sensory Attributes. A few key definitions include:
SIMS uses the same flexible Line Scales for Time Intensity data collection. Data reporting and analysis includes textual summary and detail reports, individual panelist time-intensity graphs, entire panel time-intensity graphs (using key curve parameters method) and Curve Parameter Analysis Summary using Panel Means by Sample with Significance Test (p-value). |

|
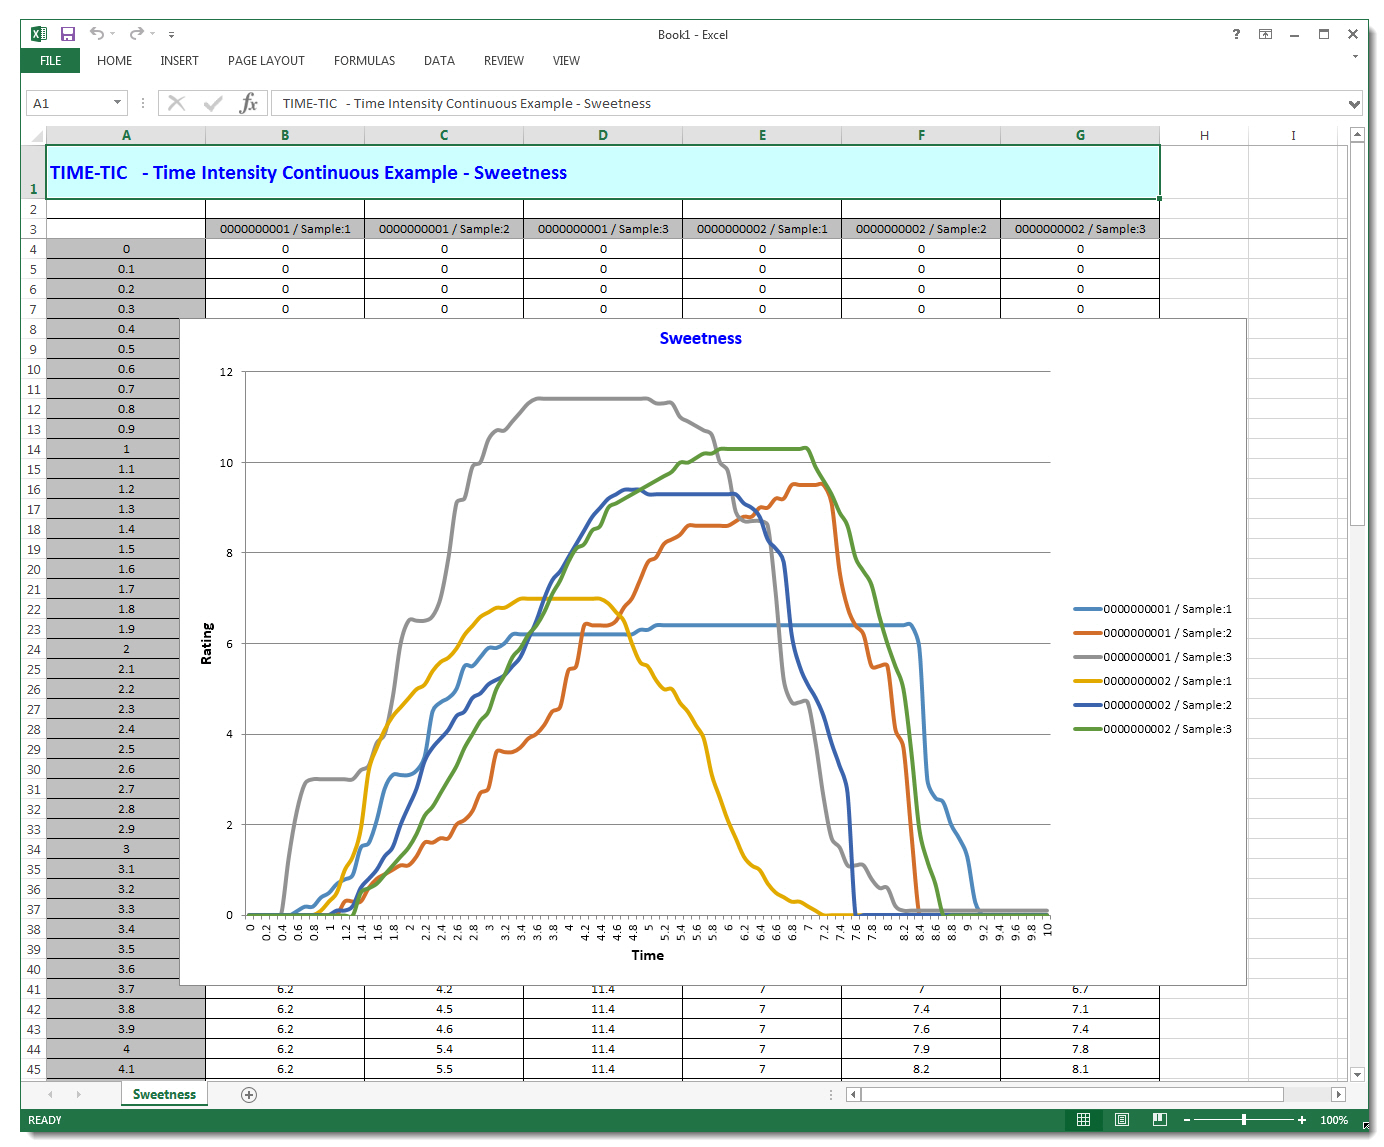
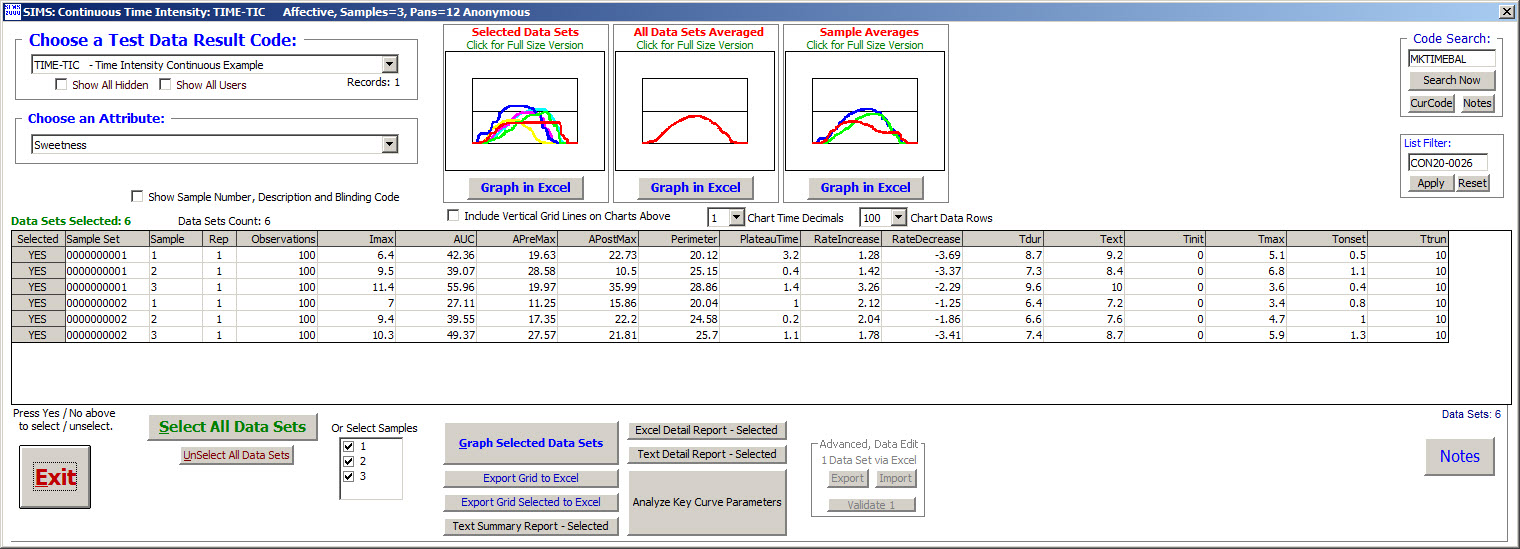
   Continuous Time Intensity
   -------------------------

     SIMS Continuous Time-Intensity follows the guidelines outlined in the 1997 ASTM E-18 document:
     ASTM E1909 - 97(2003) Standard Guide for The Time-Intensity Evaluation of Sensory Attributes.

     SIMS uses the same flexible Line Scales for Time Intensity data collection.
     Data reporting and analysis includes textual summary and detail reports, individual panelist
     time-intensity graphs, entire panel time-intensity graphs (using key curve parameters method)
     and Curve Parameter Analysis Summary using Panel Means by Sample with Significance Test (p-value).
     SIMS uses SAS to generate the stats output columns for p-values and sample separation letters.

       A few key definitions include:
         I max:  Peak Intensity, maximum observed intensity during the time of measurement
         Area after I max:  Post-peak area under the curve
         Area before I max:  Pre-peak area under the curve
         AUC:  Area under the curve (total)
         Rate of increase:  Rate of intensity increase before peak intensity (slope)
         Rate of decrease:  Rate of intensity decrease after peak intensity (slope)
         T init:  Time of initial exposure, typically when clock starts
         T onset:  Time point when the sensation is first perceived after initial exposure
         T max:  Time to reach maximum intensity of the sensation after exposure
         T plateau:  Duration of peak intensity
         T dur:  Duration time of sensation
         T ext:  Time to extinction, Time when the sensation can no longer be perceived
         T trun:  Truncate Time


   Analyze Key Curve Parameters
     SIMS is designed to use SAS statistics to generate the statistical output columns
     for p-values and sample separation letters.   Straight forward GLM procedure, X1-X14.


   Advanced, Data Edit
     Hopefully you should rarely need to edit individual Continuous Time Intensity Data.
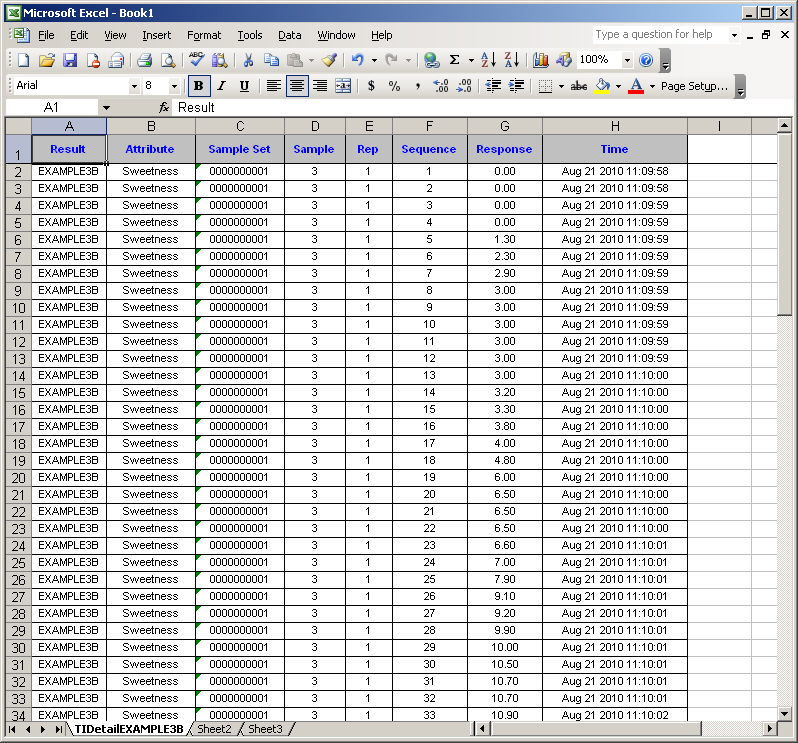
     1 Data Set via Excel.  You can edit one at a time, i.e. a panelist sample single attribute's Observations.
     Flexibility exists for Copy-n-pasting from one panelist to another, one sample to another, etc.
     Proceed with caution.  Consider practicing with a 'Copy' of your real SIMS Test Result Code.
     All of these advanced edit import events will be fully logged by the SIMS system event logs.
     General Use Instructions:
       - Export to Excel ONE Data Set you would like to Edit.  One panelist one completed TI attribute.
       - Make your editing changes in Excel and only within the Response Column.
       - Select (highlight) just the Response Column.  Do not select any other columns.
             For your current Attribute named Sweetness (Continous Time Intensity), is expecting 600 Rows.
       - Copy to Clipboard (use Edit Copy, or CTRL-C from within Excel).
       - From your SIMS System, press button for Excel Import.


   Options
   -------
     Chart Data Rows.
        100 data points or actual number of data points per panelists.
        Refers to the number of data points, per panelist, to send to the graphics program area.
        Your graphs will look almost exactly the same whether you use either 100 data points or the much bigger actual number.
        Example: Number of data points per panelists = Duration of TI in seconds * increments.
                 600 data points  =  1 minute  of .1 second increments  =  60 * 10
                 1200 data points =  2 minutes of .1 second increments  =  120 * 10
        The default for SIMS is to use 100 data points, creates the graphs much quicker.


   FAQ
   ---
     Question:  My sample average graph highest point does not match my data's IMAX average which I can see in the statistics anova tabled report, why? (or I calculated in Excel)
     Answer:    Yes, and as expected.  It's all about TIME.
                Because the graph shows TIME on the horizontal axis.  Your Panelists had differing IMAX's at different Times, i.e. differing time slices.
                The tabled calculated average figure is for all panelist's IMAX, no matter when IMAX occurred (i.e. the horizontal time).
                The tabled calculated average figure does *not* take TIME into account, the graph does!   The graph shows averages at each time slice.
                The tabled calculated average figure will always be greater then the high point of the graph (y-axis) because of TIME on the graph's x-axis.
                Note 'IMAX' term used interchangeably with 'Peak Intensity'.


  More Information on Sensory Computer Systems Website:
    https://www.SIMS2000.com/QuestionnaireContinuousTimeIntensity.asp
